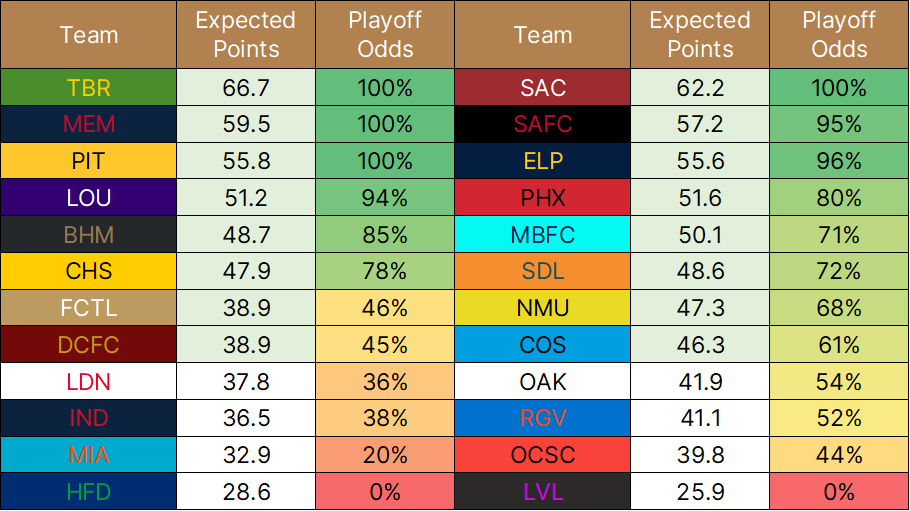
If you follow me over on Twitter, you’ll have seen the weekly post I throw out that predicts a club’s final points tally and their odds of making the playoff field. Such projections are a staple of sports data coverage across other leagues, so I decided to develop a model of my own before the 2022 campaign.
If you’re curious, the first season of the model returned an average error of 10 points for a given team based on the 2022 preseason projections. Overall, my model could explain about 85% of the variance in a team’s final points tally, and it pegged 10 out of 14 playoff teams correctly.
I’ve previously broken down the Goals Above Replacement (GAR) player evaluation metric I created, and it forms the backbone of my model.
Messy nerd shit follows. The gist is that every player gets a projected value.
I take past seasons of performance as graded by GAR, use age and projected minutes played, and turn out an expected for every player on a given roster. For signings that weren’t in the USL in the prior season, the GAR model uses their age, projected minutes, last league, and prior USL GARs if applicable to come up with a similar projection.
Birmingham’s entry in my modeling spreadsheet is shown. There’s a mess of data here, and not all of it figures in, but you can see the gist of how I organize things.
Every player gets a minutes total assigned in that “90sProj” column, and the entries are split into discrete units of five ranging from zero to 30. I try and be forward-looking as I update projections throughout the season, and I assure that every team’s minutes played equal the same final number.
The “AgeVP” column is a player’s GAR from 2022, if applicable, with an adjustment for their age. To the left, the “Est. GAR” column comes up with expected performance for new signings; note how Tyler Pasher comes with a 4.08 projection, which is equivalent to a Sean Totsch or Danny Griffin in a leaguewide context.
That projected number is then combined with the “23G” column near the far right side, which represents a player’s GAR for this season. The weight for the 2023 number increases with each passing week, and the new tally is multiplied by the minutes projection in the ultimate “ADJ” column.
More messy nerd shit follows. Every team is graded on their total player values and the points they earn as the USL season goes on.
From there, the player-by-player values are summed up for each club. That total is divided by the league average, which generates a multiplier. Say your team is 20% better than average: you get a 1.2 multiplier.
Look to the “Odds Sum” and “Raw Pts.” columns below for the product of that multiplier and the historic 44ish point average for a USL side across 34 games.
As the season rolls on, that value-based prediction is combined with a team’s actual points in the table in the “Exp. Points” column. Say you’ve played 17 games out of 34; half of the expected number comes from the GAR-based projection, and half comes from real results.
EDIT (7/20/23): Now, with a strength-of-schedule model in place, those expected points are adjusted for the opponents a team has left on the slate. The schedule factor relies on whether a match is home or away, the days of rest before that match, and the difficulty of the given opponent.
The final four columns on the right side all deal with playoff odds. I’ve dug into the chance a team qualifies for the postseason at every discrete points total and created a formula based on that research. The final output goes into the “FORMAL ODDS” column. Don’t worry about the yellow-highlighted “In-Use” column; that has to do with the graphics I put out.
End of messy nerd shit.
So that’s the gist. I’ve toyed with strength-of-schedule considerations, and I also researched the impact of player retention for the preseason number. If you’ve kept up with my writing religiously, you’ll remember me posting articles and Tweets about both of those things.
I’m not denying the importance of schedule and continuity, but I do think a simpler model pays off. Ultimately, I’m not Nate Silver, and I only have undergraduate-level competency in statistics.
Will I improve the model next year? You bet; the league variable is new in 2023. Still, that 85% R-squared value is good, and I much prefer to break down tactics and tape then obsess too hard over the spreadsheets.


