From the archive: explaining the playoff and player evaluation models
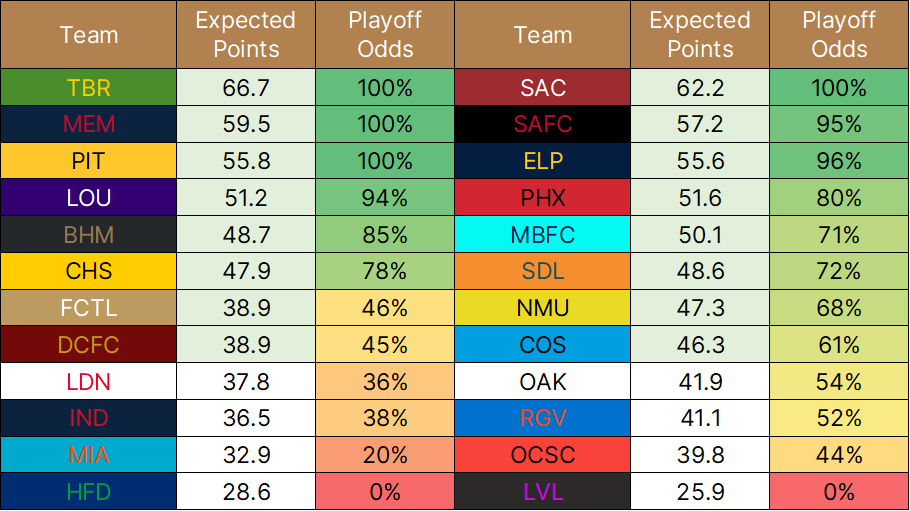
If you follow me over on Twitter, you’ll have seen the weekly post I throw out that predicts a club’s final points tally and their odds of making the playoff field. Such projections are a staple of sports data coverage across other leagues, so I decided to develop a model of my own before the 2022 campaign.
If you’re curious, the first season of the model returned an average error of 10 points for a given team based on the 2022 preseason projections. Overall, my model could explain about 85% of the variance in a team’s final points tally, and it pegged 10 out of 14 playoff teams correctly.
I’ve previously broken down the Goals Above Replacement (GAR) player evaluation metric I created (see bottom!) and it forms the backbone of my model.
Messy nerd stuff follows, but the gist is that every player gets a projected value.
I take past seasons of performance as graded by GAR, use age and projected minutes played, and turn out an expected for every player on a given roster. For signings that weren’t in the USL in the prior season, the GAR model uses their age, projected minutes, last league, and prior USL GARs if applicable to come up with a similar projection.

Birmingham’s entry in my modeling spreadsheet is shown. There’s a mess of data here, and not all of it figures in, but you can see the gist of how I organize things.
Every player gets a minutes total assigned in that “90sProj” column, and the entries are split into discrete units of five ranging from zero to 30. I try and be forward-looking as I update projections throughout the season, and I assure that every team’s minutes played equal the same final number.
The “AgeVP” column is a player’s GAR from 2022, if applicable, with an adjustment for their age. To the left, the “Est. GAR” column comes up with expected performance for new signings; note how Tyler Pasher comes with a 4.08 projection, which is equivalent to a Sean Totsch or Danny Griffin in a leaguewide context.
That projected number is then combined with the “23G” column near the far right side, which represents a player’s GAR for this season. The weight for the 2023 number increases with each passing week, and the new tally is multiplied by the minutes projection in the ultimate “ADJ” column.
More messy nerd stuff follows; suffice to say that every team is graded on (1) their total player values and (2) the points they earn as the USL season goes on.
From there, the player-by-player values are summed up for each club. That total is divided by the league average, which generates a multiplier. Say your team is 20% better than average: you get a 1.2 multiplier.
Look to the “Odds Sum” and “Raw Pts.” columns below for the product of that multiplier and the historic 44ish point average for a USL side across 34 games.

As the season rolls on, that value-based prediction is combined with a team’s actual points in the table in the “Exp. Points” column. Say you’ve played 17 games out of 34; half of the expected number comes from the GAR-based projection, and half comes from real results.
EDIT (7/20/23): Now, with a strength-of-schedule model in place, those expected points are adjusted for the opponents a team has left on the slate. The schedule factor relies on whether a match is home or away, the days of rest before that match, and the difficulty of the given opponent.
The final four columns on the right side all deal with playoff odds. I’ve dug into the chance a team qualifies for the postseason at every discrete points total and created a formula based on that research. The final output goes into the “FORMAL ODDS” column. Don’t worry about the yellow-highlighted “In-Use” column; that has to do with the graphics I put out.
End of messy nerd stuff.
So that’s the gist. I’ve toyed with strength-of-schedule considerations, and I also researched the impact of player retention for the preseason number. If you’ve kept up with my writing religiously, you’ll remember me posting articles and Tweets about both of those things.
I’m not denying the importance of schedule and continuity, but I do think a simpler model pays off. Ultimately, I’m not Nate Silver, and I only have undergraduate-level competency in statistics.
Will I improve the model next year? You bet; the league variable is new in 2023. Still, that 85% R-squared value is good, and I much prefer to break down tactics and tape then obsess too hard over the spreadsheets.
Addendum: Player evaluation!
Note: this is copy-pasted from an article I originally published on my pre-Subtack Wix site in March 2022. There's naturally been some evolution here, namely in the ability to directly source expected data.
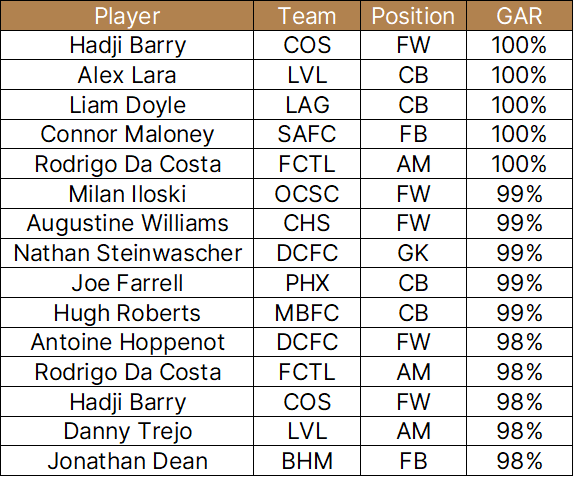
The season will be here before you know it, which means that I'll lock in my final preseason power rankings and my last offseason data-based predictions. Those numbers center around the statistic I call "GAR," which is shorthanded for "Goals Above Replacement" in an homage to baseball's "Wins Above Replacement." People regularly ask me what GAR is and how it's calculated, so I wanted to go in-depth on the subject. First, though, take a look at last year's top handful of players by GAR, listed here next to their estimated points added. We'll get into that number in a bit, but here's the table:
Not too shabby in the grand scheme of things, eh? But let's cut to the chase. The basic formula for raw GAR involves the following factors for field players:
- Expected goals and expected assists
- Defensive actions
- On/off goal difference
This probably looks like jargon to a lot of readers. To simplify further, I'll break down each input.
1. Expected goals and expected assists (xGA)
There are some very legitimate models of expected goals out there for the USL. American Soccer Analysis and FiveThirtyEight come to mind, and they do great work. That said, I want my work to rely on as few data sources as possible to guarantee internal consistency and accommodate my technical ineptitude. As a result, I generate my own xG and xA for every player.
What goes into these estimates? For xG, it's a weighted blend of shots, shots on target, and offside violations. For xA, I include key pass totals, overall pass completion percentage, and long pass completion percentage. The estimated leaders in both categories are shown below:

2. Total defensive actions (DAs)
This calculation is a lot easier. Simply, I tally up a player's total clearances, blocks, interceptions, and tackles. Done and dusted.
3. On/off goal difference
The last leg of this section starts with a team's goal difference when a player was on the pitch, weighted per ninety minutes of action. Let's use Christiano Francois of Miami FC (and now El Paso Locomotive) as an example; his team scored forty-four goals and conceded thirty-four in his 2,160 minutes. That's a plus-ten goal difference in twenty-four ninety-minute increments, yielding a plus-minus per ninety of around 0.4.
Across all of their regular-season minutes, Miami scored fifty-five times and conceded on forty occasions. Subtract out the time with Francois on the pitch, and you have a team that's plus-five across eight sets of ninety minutes, or a bit over +0.6 per game. All in all, that yields a slight penalty for Francois; Miami was something like 0.2 goals per ninety better without him.
In practice, though, the minutes where Francois is leaving a positive impact still matter. Thus, I blend the +0.4 and -0.2 values together with weighted coefficients to come up with a happy medium to capture something closer to the truth.
Great, right? You've got the components to quantify player performance in a halfway decent manner on limited data. Still, there's the issue of weighting. How much is a defensive action worth relative to an expected assist? To assess this side of things, I regressed team sums for xGA and DAs against point totals over the course of the 2019 and 2020 seasons. Basically, I looked at what number multiplied by xGA added to another number times DAs best predicted a team's results. Those mystery numbers gave me my weights.
At this point, every player has a raw value-added tally from xGA and DAs. That's devoid of context relative to position, so I normalize for that factor. Basically, every position group (FW, AM, CM, FB, CB, and GK in my data) has an average points-added that I subtract from the individual player estimate. That's where the "above replacement" bit of the name comes from, since it's comparing someone to the average (yes, I know it's more complicated in baseball). I should comment on the "goals" third of the GAR moniker as well; it's not accurate! This is ultimately a "Points Added Above Average" stat, but, uh, that's less catchy.
With this portion sorted, I then integrate the on/off component. This is meant to capture intangible impact, helping cerebral but less statistically active players like a Richie Ryan or a Tyler Gibson. I figured out these combination weights through good-old-fashioned trial and error. If, say, xGA and DAs were worth half and on/off half, the results favored players from good teams too strongly, and vice versa at the other end of the spectrum. Thus, components one and two sum to about 75% of the GAR value, and on/off adds in that final 25% or so.
These numbers, however, are combined at a percentile level. Why? There isn't a one-to-one equivalence between the derived "points added" value and the on-off, so someone in the 60th percentile in the former and the 80th in the latter nets out to a 65th percentile combined performance. Rank those new numbers, and you have my GAR% data. In my internal modelling, I transform GAR% back to a raw sum on the same scale as points added; that's the basis of my "Total GAR" team tables.
It's obvious to say, but expected goals and defensive actions are nigh meaningless for goalkeepers. Thus, you have to estimate their value in a distinct fashion, and it's taken me about two years to get to a point where I feel moderately okay. To start, I want to address the positional disparity on that previous leaderboard. In a sense, it feels wrong to see so few goalies. Still, GKs are unique. They're involved in a fraction as many plays as an average field player, and, while those plays are usually high-leverage, you can understand why the estimates of their general impact could lag as a result.
In terms of the player value calculations, I use a weighted mix of:
- Saves per goal against
- Goals against
- Goals Saved Above Average (GSAA)
The first two numbers here are standard; the third is derived, much as my xGA statistics are. My GSAA model is very simple, balancing shots on target faced versus goals allowed. I wish it could be more complex and employ shot location, defensive shielding, and a spate of other factors, but that data isn't available. Nevertheless, I combine those three listed factors together and produce a value estimate.

On average, these 'keeper value totals are around half that of a field player. Still, it isn't as easy as just doubling the goalkeeper numbers; the scale gets wonky, and you end up having a lot of mediocre goalkeepers popping up as serious contributors. To correct, I look at the percentile and z-score of a given goalie's GAR relative to other keepers and measure that by the field player scale to produce the ultimate statistic. That's why there are any goalkeepers in the standings in the first place. It's not optimal, but, as you can see in the table, you end up with a top-end goalkeeper list that's defensible by the eye test.
That brings us to the team sums that I post every Monday. As mentioned, these totals sum up the transformed GAR% numbers for every player on a given USL team. When that involves players who were in the USL in 2021, things are easy enough. The challenge comes from new entrants to the league landscape.
League One movers are the easiest since I track GAR at that tier. There's an effect where most players who make the leap end up around zero in terms of total impact, but the guys who do succeed closely replicate their League One performance. I'm not a seer, so I thus assume the best, adhering to past performance and plugging in L1 GAR totals with a minor penalty. I'll be studying the effect more closely this season.
I also have to estimate the impact of new signings from MLS, college soccer, and international leagues. Again, I'm slated to study that impact in more detail this year. For the time being, I've taken average GAR totals by position (FW, GK, etc.) and place of origin (US, Europe, Latin America, and Other). My geographic designations arose during the averaging process, where there was a vanishingly small difference between, say, English and German imports but a broader one between Europeans and domestic players. It's an imperfect system, but it's something. Additionally, I should note that the United States values here heavily inform Detroit City's projections in my tables, given their NISA-laden roster.
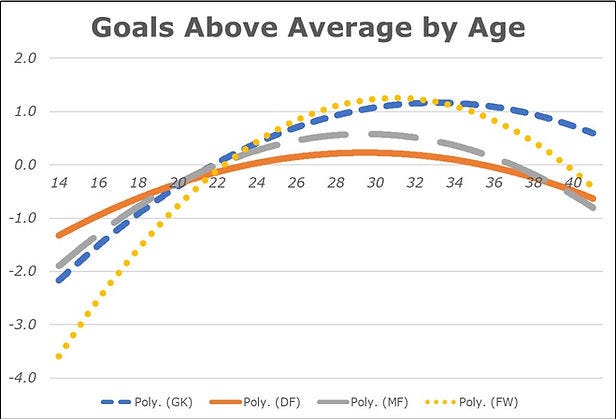
One more aspect to touch for projections: I slightly adjust for player age and, where possible, try to include past USL performance. You can see those aging curves per position in the chart; they show later primes than I would've expected across the board. This is probably because teams view young players as high-upside and are more willing to give them chances versus an older "known quantity," which can result in sustained poor performance over long stretches. Younger players are also, ya know, just worse in general. Either way, a twenty-two year old from 2021 gets a modest bump in their projected performance in 2022 as they gain experience.
In terms of past performance, I currently have three seasons of USL GAR data to work with, covering the two years that I've been discussing the Championship and one more campaign on top of that. My GAR estimates for a player in the 2022 season are composed of highly-weighted 2021 totals with age adjustments, plus more modest inclusions of past data. This helps, say, a Neveal Hackshaw with pristine performances in the '19 and '20 and a poor '21. However, it slightly punishes younger players on the rise. I think the effect is valuable to measure, and I've even adjusted 2020 GAR vis a vis pandemic-shortened minute totals for fine-tuning; still, as with everything here, there are flaws to acknowledge.
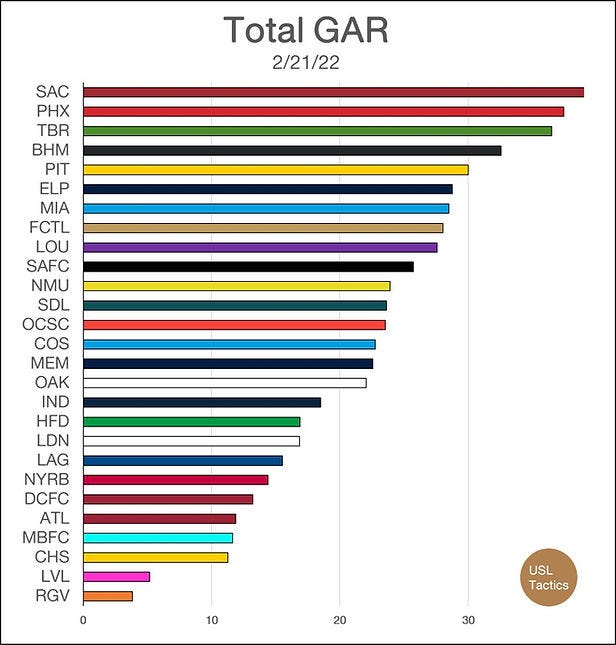
Long story short, that's how I estimate every player's value. From there, I sum those numbers up for each team and generate the crude chart that USL Twitter loves to dissect. I also have GAR per player numbers on each team, and I'm working on generating squad depth charts to produce a minutes-weighted version ahead of the 2022 season. To summarize, here's a bad graphic:

As with anything else, you have to take the numbers, GAR or otherwise, with a giant grain of salt. I use data to inform my opinions and point me in certain directions. It can’t tell me about formations, effort, or tactics beyond subtle hints, but data can spark insights that I can, say, prove through video analysis. Pairing the qualitative and quantitative and producing something actionable is the name of the game. I consider it my primary value-add as an analyst and wannabe writer; two clubs have agreed enough to employ me in technical and tactical roles to date.
Still, there's value in data despite the caveats. Those projected standings broadly match up with subjective public expectations for the 2022 season. The numbers that I put out are meant to add another perspective to the discourse around the USL, one that's theoretically more objective than a standard hot take. Whether or not you'd deem that a success is another question, but I'm trying.